GIS-rooted / full-stack engineer
Shane Bergman
I build mapping products and web applications — from spatial-data pipelines to the interfaces people use to explore them. Currently a Software Engineer at PingThings, building real-time visualization platforms for time-series sensor and geospatial data.
01 — About
From GIS analyst to lead engineer, building the tools researchers and teams use to see their data on a map.
I started my career as a Geographic Information Systems Analyst, then began tinkering with code — first simple Python scripts, then full-stack web applications. That spatial background still shapes how I work: I specialize in building mapping applications for the web, though my scope has grown well beyond that.
Today I work as a Software Engineer at PingThings, building real-time visualization platforms for time-series sensor and geospatial data — owning architecture, design, and delivery end to end.
02 — Experience
2023 — Present
Software Engineer — PingThings
Architected and delivered a production real-time visualization platform for time-series sensor and geospatial data, building information-dense interfaces that render millions of data points with sub-second performance.
2018 — 2023
Lead Front End Engineer & Solution Architect — Corteva AgriScience
Led a five-engineer team building enterprise geospatial applications supporting scientific research operations across 50+ facilities, improving visualization performance by 40% through rendering optimization and tile-based architectures.
2018 — 2022
Partner & SaaS Product Developer — MyAssetMap
Spearheaded development of a SaaS product for land development asset mapping, as both partner and lead developer.
2017 — 2018
National Director of GIS — Manhard Consulting
Directed the GIS department for an engineering and land development firm, managing teams and projects. Built an internal web mapping application for land development and site due diligence.
2012 — 2017
GIS Manager — Tamarack Consulting
Helped grow a Land Development and Civil Engineering startup from 2 to 20 people over five years, through its acquisition by Manhard Consulting. Owned all GIS projects for urban planning, land development, ROW acquisition, and site discovery.
03 — Projects
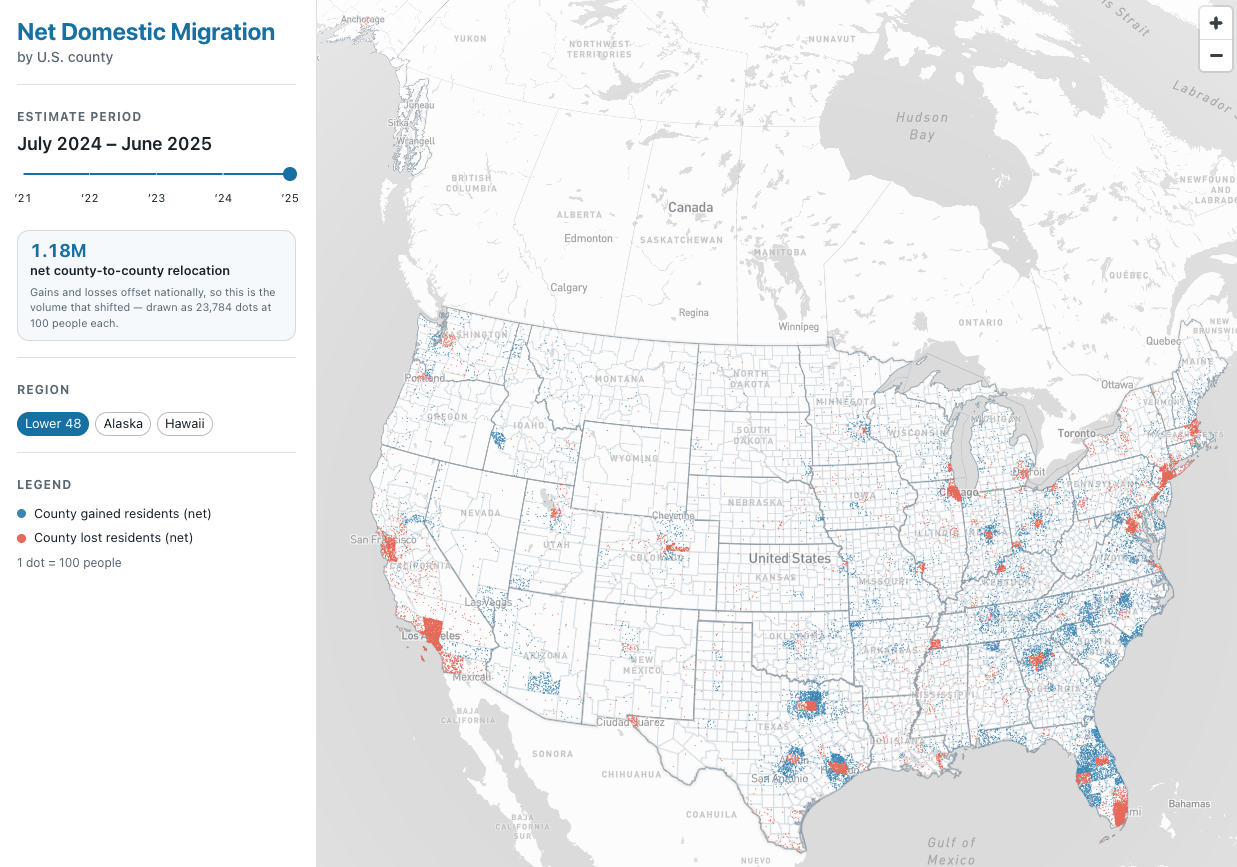
Net Domestic Migration
Every U.S. county's net domestic migration as a dot-density map — one dot per 100 people, blue where a county gained residents, red where it lost them. Dots are rejection-sampled inside Census cartographic boundaries at build time and shipped as raw Float32 buffers, so tens of thousands of points reach Mapbox as a single MultiPoint feature.
View project ↗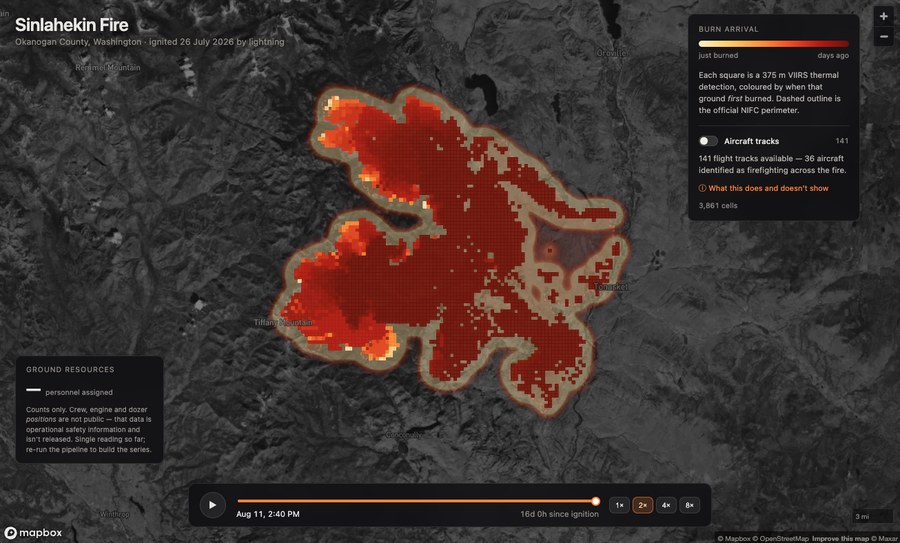
Sinlahekin Fire Progression
Washington's largest 2026 wildfire replayed hour by hour. NIFC only publishes one perimeter per incident and overwrites it, so the animation is built from VIIRS satellite burn-arrival times clipped to the official outline. Aircraft tracks come from 128 GB of public ADS-B archives, with tankers and helicopters identified by callsign, type and flight behaviour.
View project ↗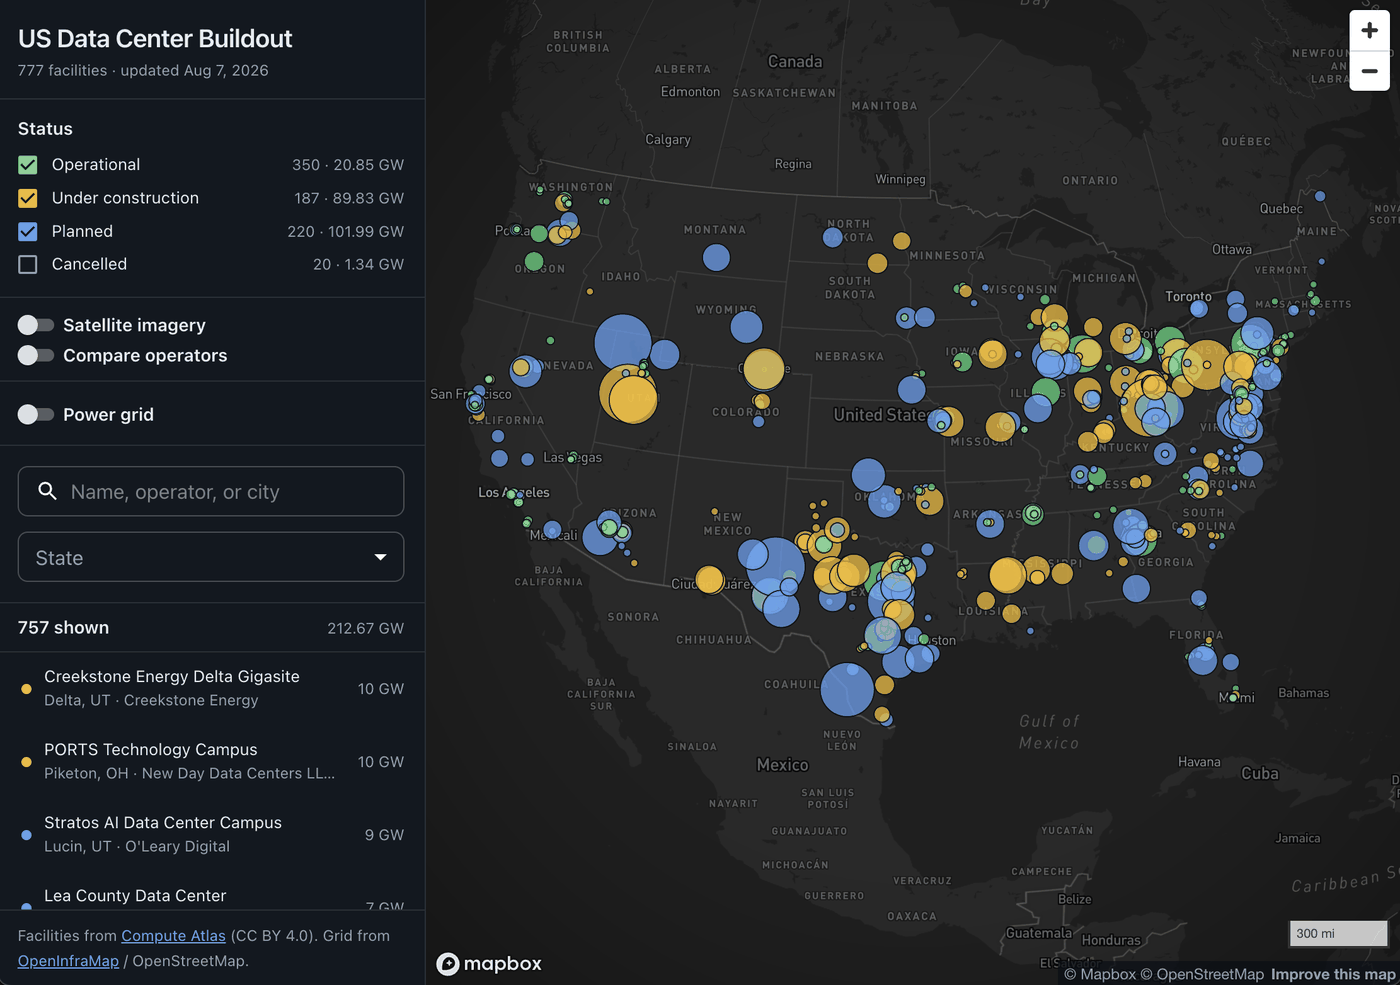
US Data Center Buildout
Every US data center in the Compute Atlas dataset, mapped by build status with circle area scaled to disclosed capacity, plus an OpenInfraMap transmission overlay styled by kV. Operators can be compared side by side; the snapshot refreshes itself daily through GitHub Actions.
View project ↗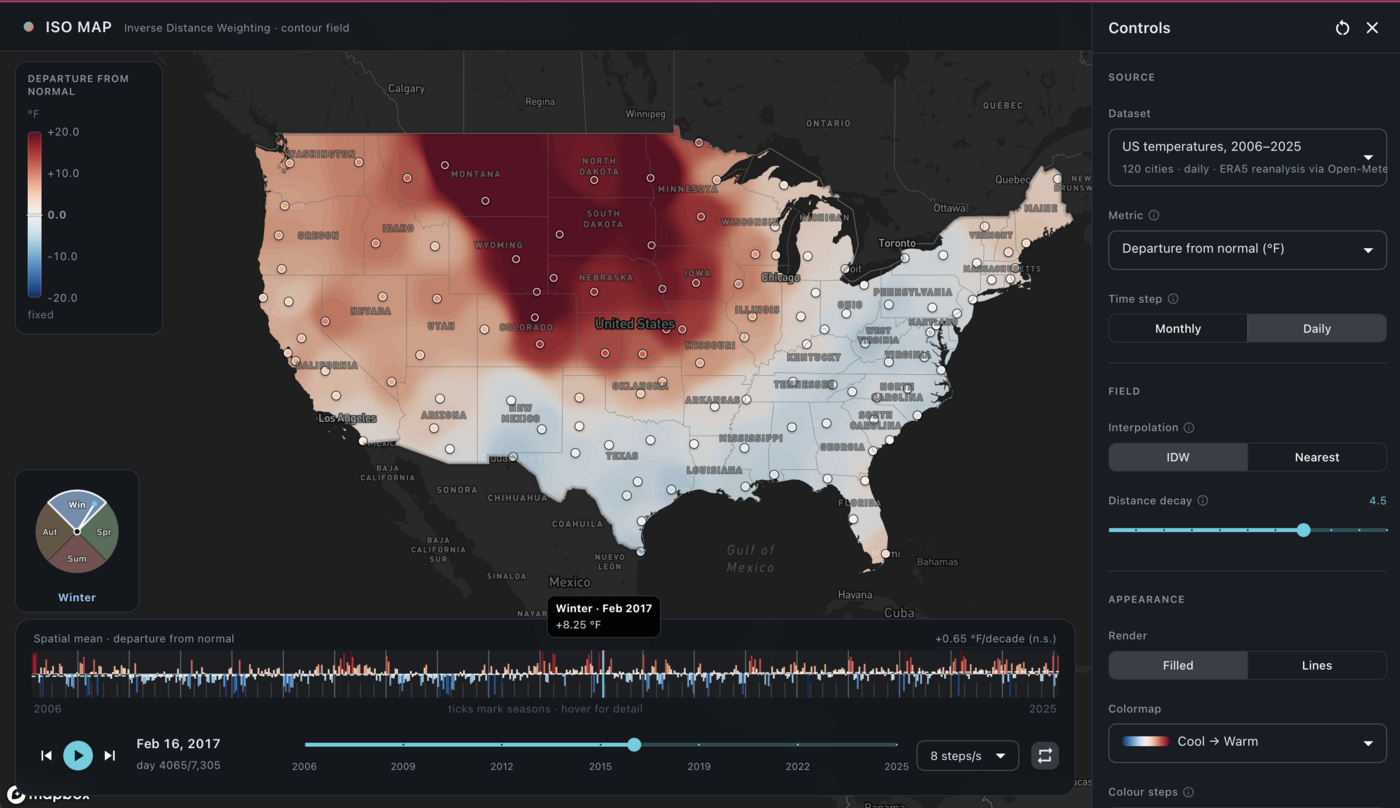
IDW Contour Map
Twenty years of daily US temperatures interpolated with inverse distance weighting, traced into contour bands with d3-contour and drawn as an SVG overlay on Mapbox. Queried in-browser with DuckDB-WASM.
View project ↗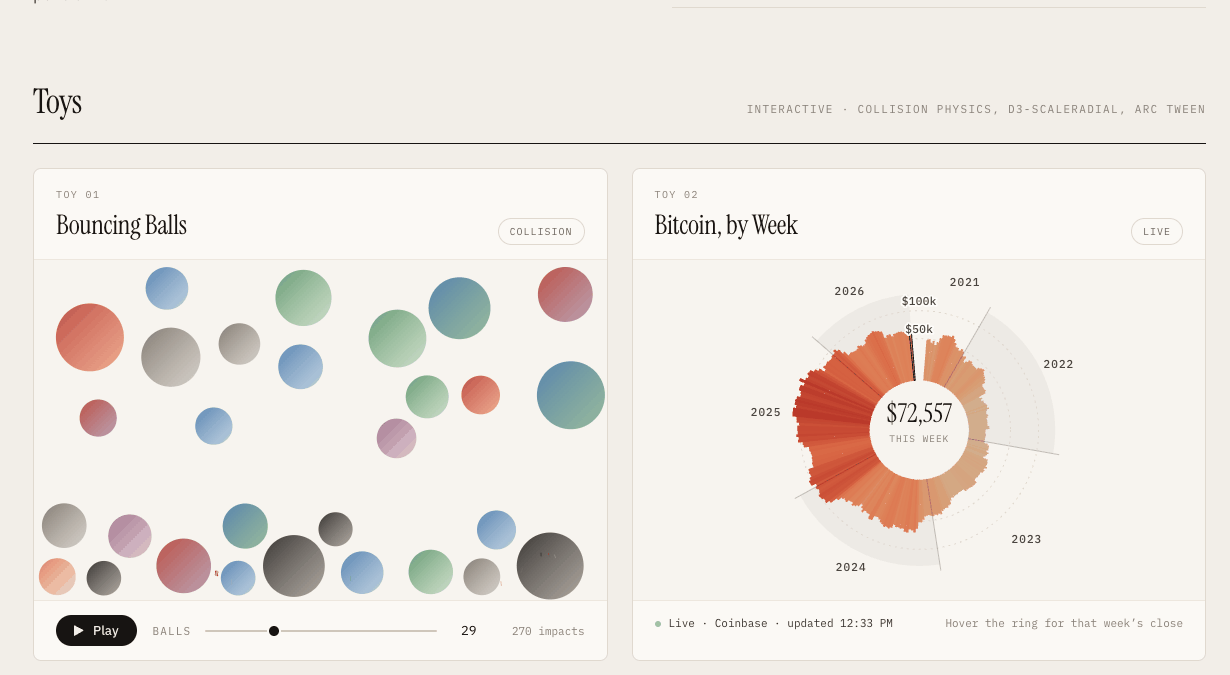
Fun With D3
A playground for D3, used to highlight techniques for visualizing both spatial and non-spatial data.
View project ↗NextJS Dashboard
A dashboard built with Next.js and Tailwind CSS, built to gain hands-on experience with the framework. Planned: dynamic data via an editable Prisma database.
View project ↗Mapbox Draw Tool
A simplified draw tool for the Mapbox API. Users can create, edit, and delete GeoJSON polygons and lines directly on the map.
View project ↗